

Introduction
The third quarter was a reminder that markets rarely move in a straight line. Investors navigated rising interest rates, persistent inflation concerns, elevated energy prices, geopolitical tensions, and a meaningful pullback in portions of the technology sector. Beneath the surface, there was significant rotation as many of the market’s strongest performers from earlier in the year gave back some gains while capital flowed into areas that had previously lagged. While these shifts can create short-term uncertainty, they are a normal part of investing and reinforce the importance of maintaining a diversified, long-term approach.
As we enter the final months of the year, there is no shortage of issues competing for investors’ attention. Ongoing conflict in the Middle East continues to impact energy markets, inflation remains a concern, and the Federal Reserve has resumed raising interest rates. At the same time, the tremendous amount of capital being invested in artificial intelligence has led many to question whether future returns will justify today’s spending. These are valid concerns, but they should be viewed within the broader context of an economy and corporate sector that continue to demonstrate resilience.
At Aurdan, we remain focused on the long-term fundamentals rather than the day-to-day headlines. We continue to see strength across many areas of the economy, particularly in businesses benefiting from innovation, infrastructure investment, semiconductor manufacturing, artificial intelligence, and cybersecurity. Corporate earnings remain healthy, balance sheets are generally strong, and companies continue to invest for future growth. While market volatility is always possible, we believe these crosscurrents are manageable and do not change our constructive intermediate- and long-term outlook. As always, our focus remains on building diversified portfolios designed to participate in long-term growth while helping clients navigate periods of uncertainty along the way.
The Economy
Like the first two quarters of 2026, the economy in Q3 was characterized by solid economic growth, stable labor markets, and sticky inflation. For third quarter economic growth, the Federal Reserve Bank of Atlanta’s GDPNow model is forecasting a strong 3.7% real GDP growth rate. Goldman Sachs economists are slightly less bullish but still constructive, calling for 3.4% growth in Q3. Both figures are well above the long-term trend growth rate of around 2% and point to steady consumer spending paired with high levels of AI-related business investment.
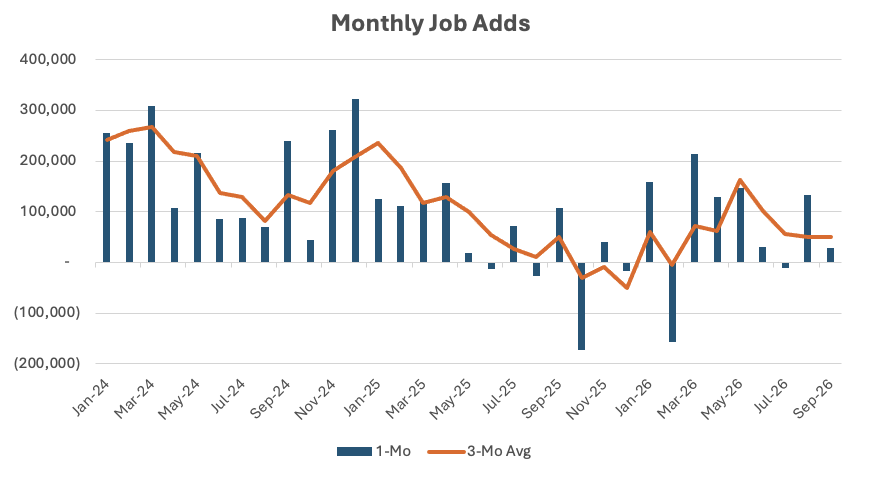
The labor market remained stable over the third quarter. The U.S. economy added 50,000 jobs per month and the unemployment rate was unchanged to 4.2%. Jobless claims hovered near the lowest levels since the 1960s, indicating layoffs were subdued.
While growth and employment appear healthy, the pain point for most Americans continues to be inflation. The 12-month increase in the Consumer Price Index (CPI) ended the quarter at 3.4%, up from 2.9% one year ago. The recent pickup in inflation can be attributed to energy costs as the price of oil is nearly 50% higher year-over-year. Price pressures outside of energy remain elevated but do not indicate inflation is spiraling out of control. Goods and services prices, which account for roughly 80% of CPI, increased 0.7% and 3.0% over the past year. Further, the 5-year inflation breakeven rate, or what the market expects annual inflation to be over the next five years, currently sits at 2.4%.
The Federal Reserve
As we’ve covered before, the Federal Reserve (Fed) is tasked with the dual mandate of maximum employment and price stability. With a 4.2% unemployment rate and jobless claims near multi-decade lows, the Fed can be confident that the labor market is at, or at least near, maximum employment. On price stability, the Fed targets 2.0% annual inflation and will adjust policy to achieve this target. As mentioned above, CPI is running at 3.4% and has been above 3.0% for six straight months. Further, CPI has not been at the 2.0% target since February 2021, a period of 5.5 years.
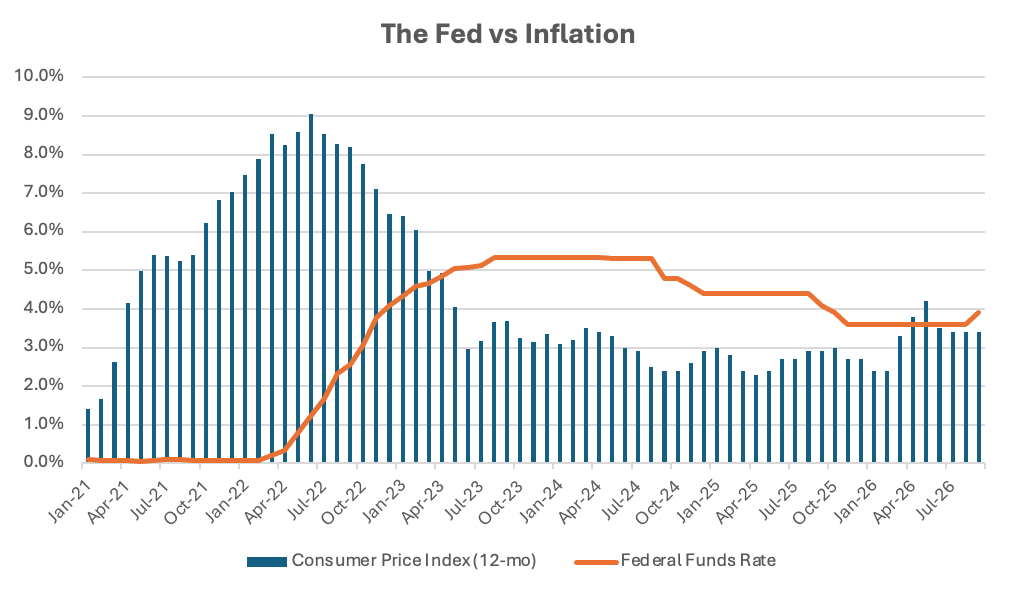
In response to higher inflation and stable employment, the Fed raised short-term interest rates in September by 0.25%. This marked the first interest rate hike since July 2023 and increased short-term interest rates to 3.9%. The Fed’s dot plot, an aggregation of each committee member’s interest rate outlook, pointed to one or two more hikes over the next 12 months. The market disagrees, pricing in a more aggressive hiking cycle. Fed funds futures contracts are pricing in one more hike in 2026 followed by two more in the first half of 2027. This would take short-term interest rates to 4.6%, the highest level since late 2024. The treasury market backs up this outlook, with the 2-year treasury yielding 4.9% at the end of Q3, the highest level in 2.5 years.
The path for short-term rates should ultimately depend on the Iran conflict and its impact on energy markets. A post-midterm resolution that sees oil prices ease could allow the Fed to hike only two or three times this cycle. However, a prolonged conflict that drags into 2027 would limit the downside in oil prices, keep inflation elevated, and likely force the Fed to meet the market’s expectation for four hikes.
Midterms
If one couldn’t tell from the copious number of political ads on television, the 2026 midterms are just around the corner. On November 3rd, Americans will vote to fill various seats of government ranging from the local to federal level. The federal government has been under Republican control since the 2024 election but that is slated to change according to prediction markets. Odds makers currently give the Democrats a 90% chance of retaking the House of Representatives next month while the chances of flipping the Senate are a bit lower at around 60%.
It is important to remember that whoever controls the government tends to have very little impact on subsequent investment returns. The S&P 500 Index has managed to post double digit annual returns across unified government, unified congress, and split congress.
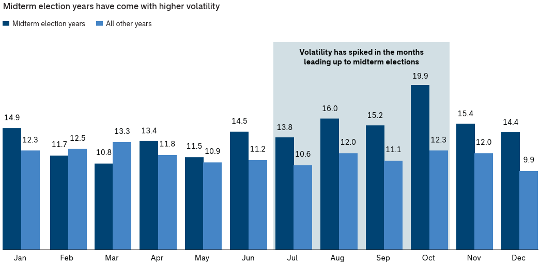
One other important fact to remember is that midterms tend to increase stock market volatility. The S&P 500 volatility in October of midterm election years averages 20%, notably higher than the 12% average in non-midterm year Octobers. Given this, we would not be surprised to see some choppiness in equity markets as November 3rd approaches. The good news is the midterms tend to act as a clearing event, with volatility falling and stock prices rising on average in the months after the election.
Equities
Looking back at our previous commentary, the second quarter saw an incredible run for equities with U.S. stocks, measured by the S&P 500, rising 15% and international stocks, measured by the MSCI ACWI Ex USA, increasing 12%. While we wish every quarter was this way, it was inevitable that stock market gains would slow in Q3. This is precisely what happened with U.S. stocks gaining 2% while international stocks declined 1%.
Highflyers tied to the AI buildout stumbled this past quarter with semiconductor and industrial stocks declining 7% and 10%, respectively. Value-oriented sectors guided the market higher with energy and health care stocks rising 17% and 7%, respectively.
Looking at valuations, the S&P 500 traded at 19x forward earnings at the end of Q3. This is right in line with the 10-year average but moderately elevated compared to the 30-year average of 17x. The 19x figure is down from 21x at the beginning of the year.
While multiples have contracted year-to-date, earnings forecasts have surged, with analysts projecting 32% earnings growth in 2026 and 15% earnings growth in 2027. The shrinking multiple indicates the market is evaluating AI-driven earnings growth with a healthy degree of skepticism. This is an encouraging sign in our opinion as it is not indicative of investor behavior typically seen in asset price bubbles. We continue to stress a diversified approach in equities balancing exposure to AI and technology companies with allocations to value, small cap, and international stocks.
Fixed Income & Alternatives
Interest rates stole the show this past quarter as the 10-year treasury yield surged to 5.3% and ended Q3 at the highest level since 2007. The dramatic move in rates sparked a 4% decline in core taxable bonds and a 5% decline in core municipal bonds. Credit spreads remained tight due to the robust economic and earnings backdrop, resulting in shorter duration and lower quality bonds outperforming longer duration and higher quality bonds.
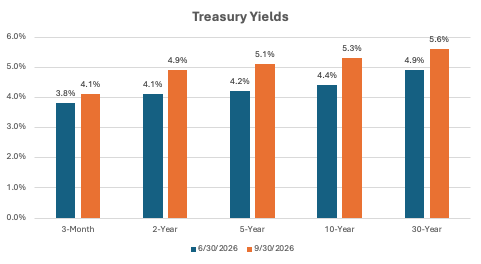
The current level of interest rates presents the best opportunity to lock in yield since late 2023. While money market funds and other cash equivalents yield 3.5-4.0%, investors can pick up 100 bps of yield by stepping out into short-to-intermediate high-quality fixed income. These fixed income allocations will also have the potential to add to returns in periods of stock market volatility, unlike cash.
While the interest rate volatility this past quarter weighed on bond portfolios, alternative asset classes managed to sidestep the negative returns. Direct lending and core infrastructure both posted positive returns in Q3. These asset classes can act as inflation and interest rate hedges while simultaneously diversifying stock market risk. We continue to favor allocating a portion of fixed income portfolios, where appropriate, to defensive, income-oriented alternative asset classes.
Conclusion
As we look ahead to the final quarter of the year and into 2027, we expect markets to remain focused on inflation, interest rates, geopolitical developments, and the pace of investment in artificial intelligence. These factors may create periods of volatility, particularly as investors continue to evaluate the long-term impact of higher interest rates and shifting economic conditions. While short-term market movements are impossible to predict, the broader backdrop of solid economic growth, healthy corporate earnings, and continued business investment remain supportive for long-term investors.
At Aurdan, we believe successful investing is built on discipline, diversification, and maintaining perspective during periods of uncertainty. Rather than attempting to anticipate every market headline or policy change, we remain focused on constructing portfolios that can participate in long-term growth while managing risk across a variety of market environments. We appreciate the trust you place in our team and remain committed to helping you achieve your financial goals through thoughtful planning and prudent investment management.
IMPORTANT DISCLOSURES
The views, opinions and content presented are for informational purposes only. The charts and/or graphs contained herein are for educational purposes only and should not be used to predict security prices or market levels. The information presented in this piece is the opinion of Aurdan Capital Management and does not reflect the view of any other person or entity. The information provided is believed to be from reliable sources, but we cannot guarantee the accuracy or completeness of the information, no liability is accepted for any inaccuracies, and no assurances can be made with respect to the results obtained for their use. The information contained herein may be subject to change at any time without notice. Past performance is not indicative of future results.