
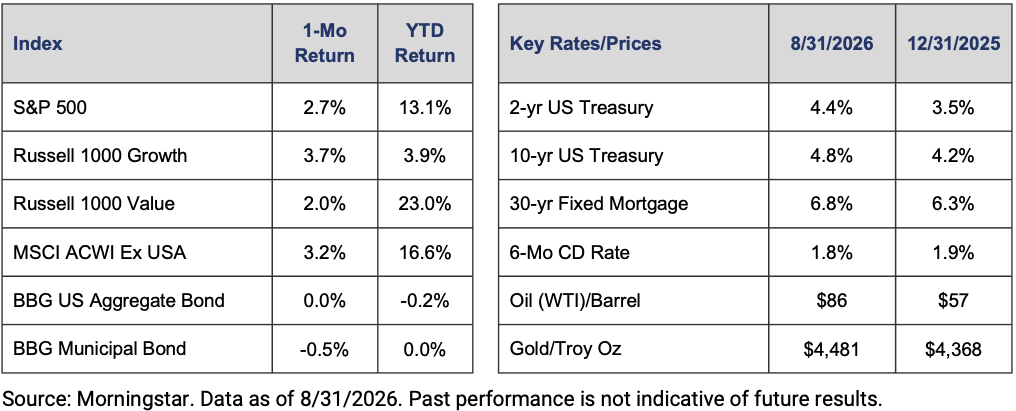
The S&P 500 Index rose 3% in the month of August. However, the index booked most of that gain in the first two days of the month before trading sideways for the rest of the period. International stocks, measured by the MSCI ACWI Ex USA Index, were also up 3% in August. Despite elevated volatility, oil prices ended the period little changed with October WTI contracts trading around $85. Interest rates were the story of the month as the 10-year Treasury rose to 4.75%, the highest level since early 2025.
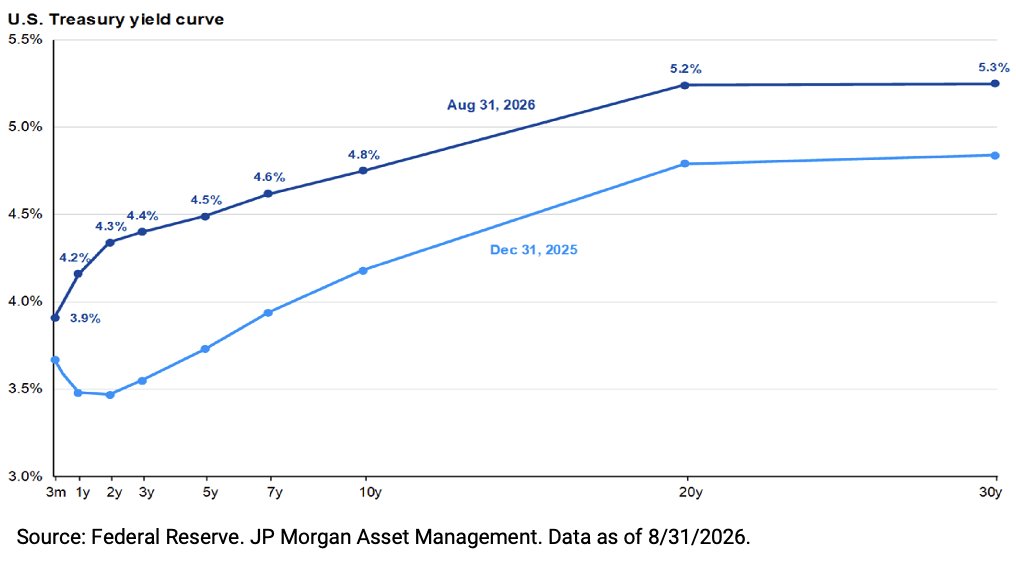
Fed Chair Warsh gave the clearest indication yet that the Fed will likely embark on a rate hiking campaign in the coming months. In his speech at the annual Jackson Hole Economic Policy Symposium, Warsh stated the Fed’s focus should be on prices given the stable growth and employment backdrop. The markets were quick to react, pricing in one hike this year and another in early 2027. Rates moved higher across the curve with the 2- and 10-year treasury yields now at 4.35% and 4.75%, respectively.
Inflation has been above target for over five years. Core PCE, the Fed’s preferred inflation gauge, rose 3.3% year-over-year in July, well ahead of the 2% target. GDP growth has been strong, bolstered by consumer spending and the AI buildout. At the same time, the unemployment rate remains low at around 4%. This environment allows the Fed to zero in on inflation, increasing the odds of a mid-cycle adjustment where the Fed hikes a handful of times over the next year.
Given the backdrop of rising rates and elevated inflation, we continue to prefer fixed income instruments that are shorter in duration. Given the solid economic environment, credit sectors offering yield premiums over treasuries should continue to outperform. Finally, alternative asset classes like infrastructure and direct lending have the potential to outperform in a rising rate environment.
IMPORTANT DISCLOSURES
The views, opinions and content presented are for informational purposes only. The charts and/or graphs contained herein are for educational purposes only and should not be used to predict security prices or market levels. The information presented in this piece is the opinion of Aurdan Capital Management and does not reflect the view of any other person or entity. The information provided is believed to be from reliable sources, but we cannot guarantee the accuracy or completeness of the information, no liability is accepted for any inaccuracies, and no assurances can be made with respect to the results obtained for their use. The information contained herein may be subject to change at any time without notice. Past performance is not indicative of future results.