

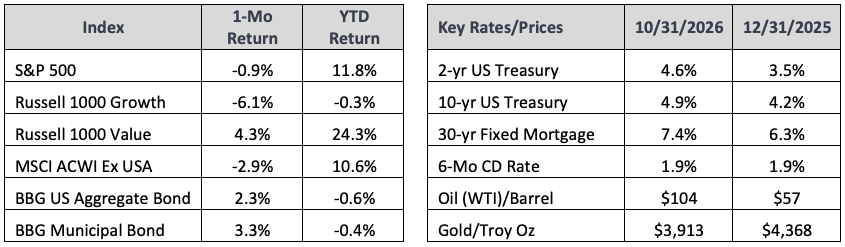
The S&P 500 Index declined 1% in October. Under the surface, the market rotated out of artificial intelligence (AI) stocks and into defensives names as the sentiment around AI investment began to sour. Value stocks rose 4% while growth stocks declined 6%. Further, the technology sector shed 8% in October while the health care and consumer staples sectors rose 10% and 11%, respectively. Bonds also protected portfolios as AI stocks declined with the 10-year treasury yield falling 40 basis points to 4.9%.
CoreWeave became a household name last month as the company’s stock declined 37% and the yield on its debt surged to 15%. CoreWeave is the largest of a new cohort of companies called neoclouds. Essentially these companies build datacenters that exclusively own graphics processing units (GPUs). They then rent out the computing capacity to hyperscalers like Microsoft and Amazon and AI developers such as OpenAI and Anthropic. CoreWeave has been one of the more aggressive neoclouds, borrowing heavily to fund the construction of its datacenters. Concerns over the timeline of AI monetization paired with the company’s high debt load sparked a steep selloff in the neocloud stocks which spilled over into the larger AI and technology names.
Fortunately, the pain was not felt at the index level with the S&P 500 posting just a modest loss. However, this episode serves as a useful reminder of why diversification is the only free lunch in investing. While popular AI stocks and ETFs finished the month in the red, value stocks and fixed income outperformed. This will certainly not be the last bout of volatility surrounding the AI investment theme and we continue to recommend an allocation to both AI winners as well as stocks that can compound regardless of AI investment and adoption.
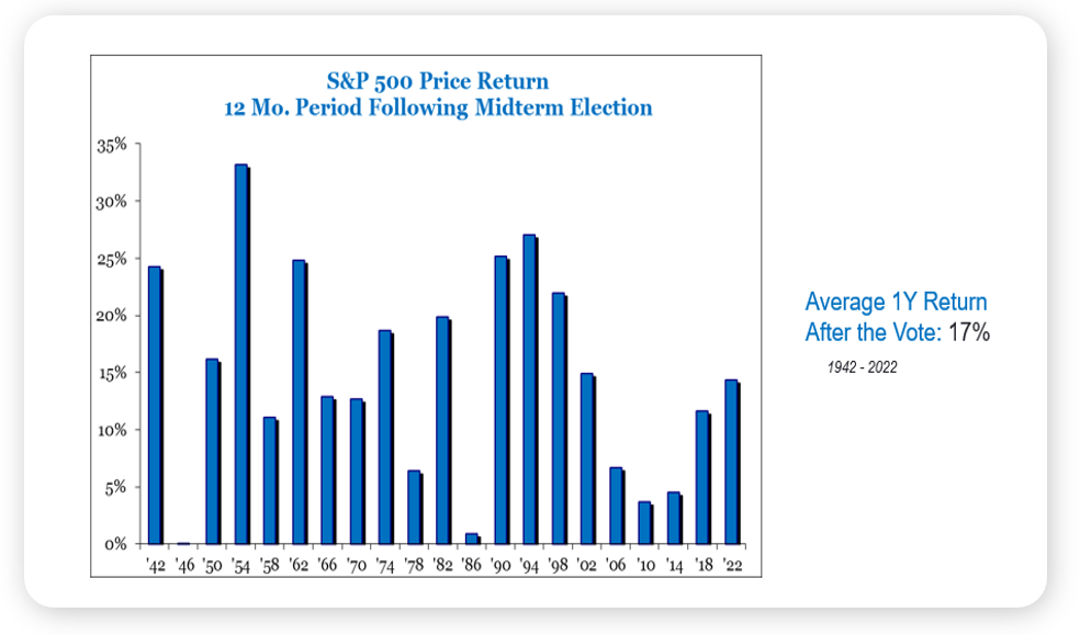
Elsewhere, Americans head to the polls on November 3rd to vote in the 2026 midterm election. Prediction markets currently give the Democrats a 90% chance of retaking the House of Representatives and a 70% chance of retaking the Senate. Years in which midterms take place are historically more volatile than non-election years. However, while they can be the source of short-term volatility leading up to voting, as the market gains more clarity, returns following midterm elections are much more promising. The chart below shows that of the 21 midterms that have taken place going back to 1942, all saw positive returns over the next 12 months, with an average return over that period of nearly 17%.
Aurdan Capital doesn’t profess to knowing if the following year will produce more of the same post-midterm gains, or if this will be the year that bucks this historically strong trend. Instead, it’s important to remember that the performance of the market tends to have very little to do with which political party is in power and investors should avoid letting political leanings influence their investment decisions.
As always, please reach out to a member of the Aurdan Capital team if you have any questions regarding the market environment or your portfolio.
IMPORTANT DISCLOSURES
The views, opinions and content presented are for informational purposes only. The charts and/or graphs contained herein are for educational purposes only and should not be used to predict security prices or market levels. The information presented in this piece is the opinion of Aurdan Capital Management and does not reflect the view of any other person or entity. The information provided is believed to be from reliable sources, but we cannot guarantee the accuracy or completeness of the information, no liability is accepted for any inaccuracies, and no assurances can be made with respect to the results obtained for their use. The information contained herein may be subject to change at any time without notice. Past performance is not indicative of future results.