

Introduction
As we close the first half of 2026, the themes that best describe the economy and financial markets are resilience and durability. Despite navigating a period marked by geopolitical tensions, policy uncertainty, and persistent inflation pressures, both markets and the broader economy have continued to perform better than many anticipated. Global growth remains near its long-term trend, supported by healthy consumer spending, ongoing business investment, productivity improvements, and strong corporate profitability.
A notable development during the quarter was the diplomatic agreement reached between the United States and Iran. While initially viewed as a positive step toward reducing geopolitical tensions, developments since the announcement have highlighted the uncertainty surrounding the durability and ultimate effectiveness of the arrangement. As a result, the long-term implications remain difficult to assess.
Markets generally responded favorably to the prospect of reduced tensions and a more stable outlook for energy markets and the broader region. However, the situation remains fluid, and recent developments serve as a reminder that geopolitical agreements can evolve quickly and often face implementation challenges. We will continue to monitor events closely and evaluate any potential implications for the economy, financial markets, and client portfolios.
While the overall backdrop remains constructive, unpredictability continues to characterize the investment landscape. Economic data often sends mixed signals. Strong employment reports and resilient consumer demand can quickly be offset by concerns surrounding AI-driven workforce reductions, shifting consumer behavior, or evolving policy developments. As a result, market sentiment can change rapidly, even as underlying economic fundamentals remain relatively sound.
Against this backdrop, new Federal Reserve Chair Kevin Warsh has assumed leadership at a particularly challenging time. Economic growth remains resilient, inflation continues to run above the Fed’s target, and geopolitical risks have not disappeared. We expect the Federal Reserve to remain patient through at least year-end, carefully evaluating incoming data before making any significant policy adjustments. As always, we believe maintaining a disciplined, long-term investment approach remains the most effective way to navigate periods of uncertainty while participating in the opportunities that durable economic growth can create.
Equities
The second quarter saw incredible returns from risk assets across the board. Starting the quarter near the bottom of the Iran War-driven selloff, the S&P 500 Index went on to return 15% in Q2. The technology sector surged 44% over the second quarter as AI-focused companies benefited from the data center buildout. Small cap stocks, measured by the Russell 2000 Index, posted a very strong quarter, rising 21% and beating large cap stocks by 6%.
International markets posted solid Q2 returns as well with the MSCI ACWI Ex USA Index gaining 12%. Stocks in developed markets like Europe and Japan saw returns in the 5-10% range. Emerging market stocks jumped 20% led by massive gains from technology companies located in South Korea and Taiwan.
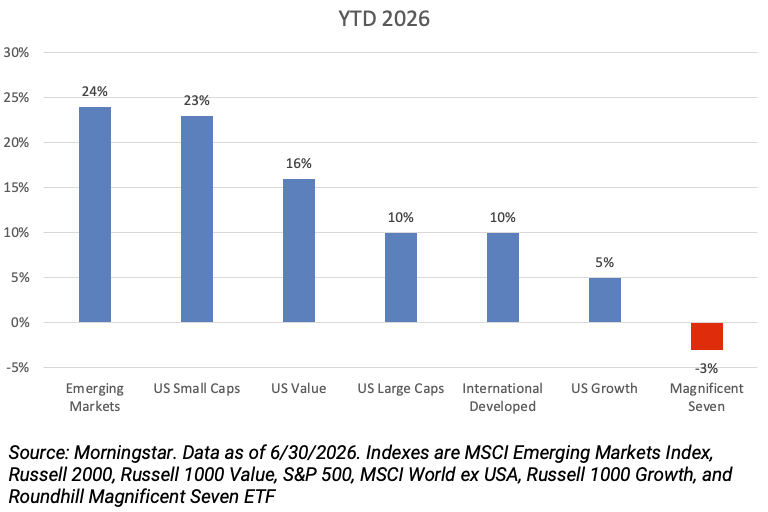
One of our themes coming into 2026 was a broadening out of performance. For most of the 2023-2025 rally, the Magnificent Seven, a cohort of U.S. technology names including Apple, Microsoft, and Alphabet, was responsible for a disproportionate amount of the return. This trend has reversed so far in 2026 with virtually every equity index outperforming the Magnificent Seven’s -3% return. Emerging markets and small cap stocks have been the biggest beneficiaries of this theme so far this year, with both indexes up more than 20%.
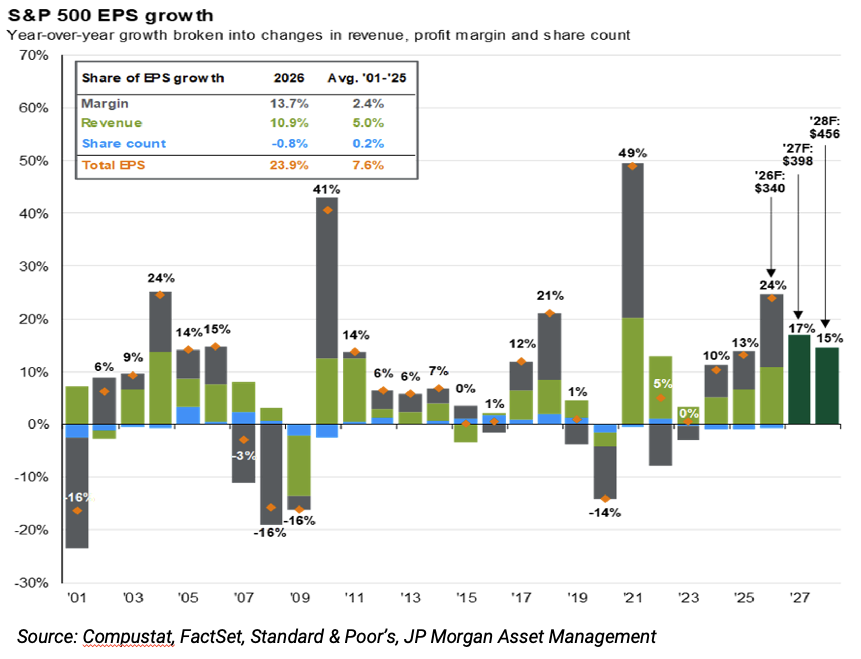
The key driver behind the broadening has been earnings growth. Analysts have continued to revise their projections for 2026 and 2027 higher. The Magnificent Seven companies have committed to spending all their profits over the next few years on data centers and AI projects. Their spending is translating into increased profits for companies building and supplying the data centers and AI projects in areas like small caps, industrials, and materials.
Analysts expect the S&P 500 earnings per share to grow 24% over the next year. Given current estimates, the S&P 500 trades at 20x forward earnings, down from 22x at the start of the year. This is largely due to earnings growth expectations outpacing market returns and means that the index is cheaper today than it was six months ago despite rising 10% over that time.
The market is clearly tilted more towards greed than fear currently, which is understandable. Prolonged negative effects from the Iran War appear to have been avoided, the economy remains on solid footing, and the country is in a once in a generation industrial capex cycle. With that said, valuations remain above average and market indexes are concentrated in technology and AI-focused companies. As the broadening trade has shown so far this year, it is important to remain diversified within equities by allocating to areas like U.S. value, small caps, and international stocks.
The Economy
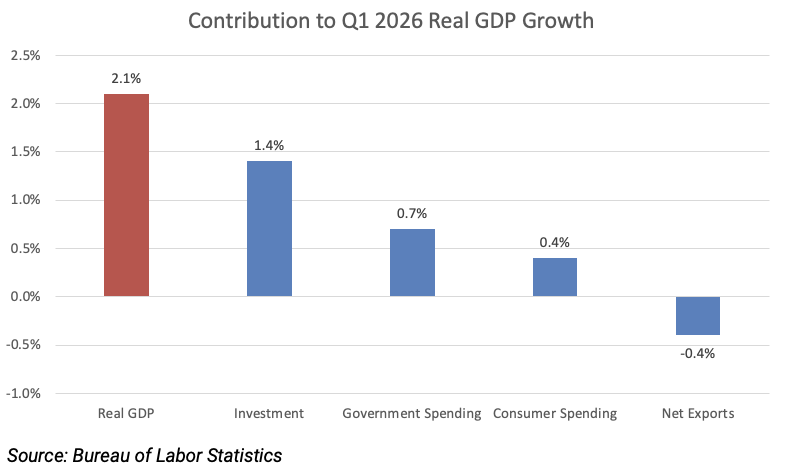
Real GDP grew at a 2.1% annual pace in the first quarter and is expected to have grown at similar rate in Q2. Consumer spending, the main driver of the economy, remains positive but has weakened over the past year. While higher income households have continued to spend, middle- and lower-income households have pulled back on discretionary spending in the wake of higher inflation and a benign hiring environment.
Picking up the slack has been business investment. Investment accounted for nearly 70% of real GDP growth in the first quarter as companies continued to invest in data center and AI projects. A mix of tepid consumer spending and hot investment figures should keep real GDP growing at a 2% pace for the rest of 2026.
The labor market strengthened over the second quarter with the U.S. economy adding roughly 300,000 jobs over the past three months. The unemployment rate eased to 4.2%, the lowest level in 12 months, and the number of jobless claims remained near multi-year lows.
As expected, inflation surged in Q2 as energy prices spiked. The May Consumer Price Index (CPI) increased 4.2% year-over-year, the highest print since April 2023. Energy prices rose 24%, accounting for a large portion of the increase. With oil prices receding in the wake of an agreement between the U.S. and Iran, we expect price pressures to ease over the coming months. However, a return to the Federal Reserve’s 2% target seems unlikely anytime soon, with CPI projected to end the year above 3%.
The Federal Reserve
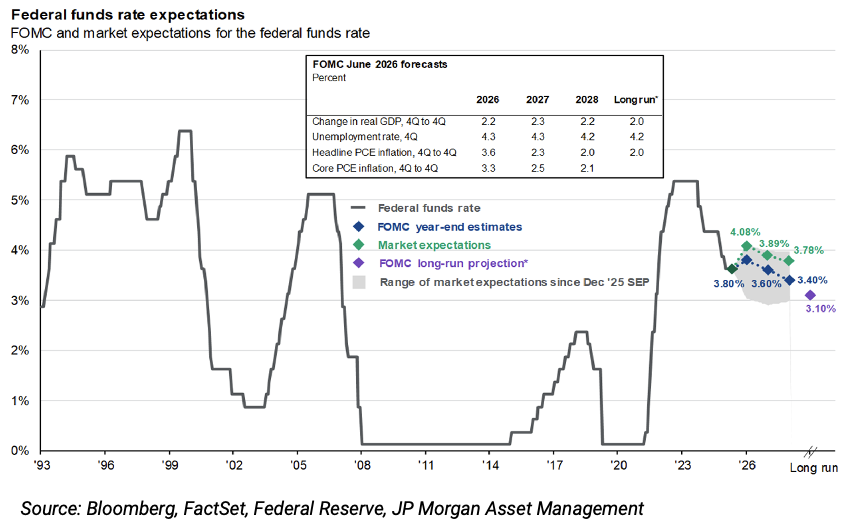
For the first time in eight years a new face took the podium at the June Federal Open Market Committee (FOMC) meeting. Kevin Warsh kicked off his term as Fed Chair in a hawkish manner, vowing to drive inflation down to 2% over his tenure. While the Fed did not hike interest rates at the June meeting, the market took Warsh’s words at face value and quickly priced in one to two hikes over the rest of the year.
Warsh announced five separate task forces that will examine various policies at the Fed relating to matters such as communication, the balance sheet, and data sources. It is important to remember that the FOMC consists of 12 voting members and not just one person. However, Warsh seems determined to leave his mark on the institution, leading us to anticipate less communicative and more volatile monetary policy on a go forward basis.
The FOMC also produced their quarterly Summary of Economic Projections in June. The committee expects real GDP growth of around 2% this year and next paired with a stable unemployment rate of 4.3%. The big change came with their inflation projections, reflecting the recent spike in energy prices. The Fed now sees inflation around 3.5% for the rest of this year before falling towards 2% in 2027 and 2028.
With a stable labor market, the Fed will focus their attention on inflation. For now, the market seems sanguine about future price pressures with 5- and 10-year inflation breakeven rates at just 2.2%. In this environment, the Fed can remain on hold and wait for more data to flow in. If inflation expectations begin to rise, the Fed may be forced to act. In this scenario we would expect a series of rate hikes over the next 12 months.
Fixed Income & Alternatives
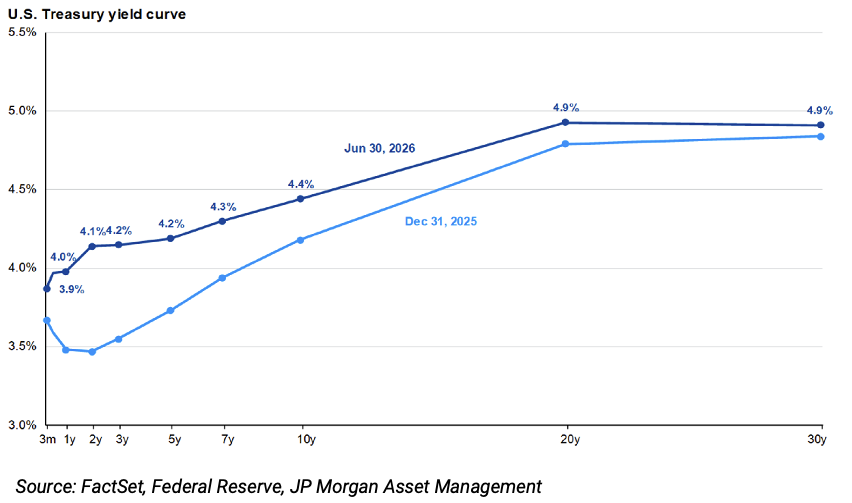
Interest rates remained volatile in the second quarter. After dipping below 4.0% at the end of February, rising energy prices led the 10-year yield to spike 70 basis points in less than three months. After peaking at nearly 4.7% in mid-May, the 10-year yield declined 30 basis points as energy prices receded to end the quarter at 4.4%.
For the quarter, core fixed income produced a 1% return while core municipal bonds returned 2%. Lower quality fixed income such as high yield corporate bonds and bank loans produced 2% returns as well. We expect interest rates to remain volatile over the rest of the year given lingering geopolitical issues and the uncertain monetary policy backdrop. We anticipate 2026 returns for core bond portfolios to largely match their starting yields of 3-4%.
Alternative assets largely sidestepped the volatility in interest rates this quarter, producing low single-digit returns with little volatility. Our objective when allocating to alternatives is to increase diversification without sacrificing return potential. We continue to favor infrastructure assets in the current inflation and interest rate environment. Infrastructure assets tend to act as an inflation hedge while exhibiting lower correlation to interest rate movements when compared to fixed income. Infrastructure is also experiencing a secular tailwind at the moment as companies and nations race to reshore critical industries, construct data centers, and increase electrical supply to meet rising demand.
Conclusion
Despite ongoing uncertainty in the capital markets, which is so often the norm and not the exception, we continue to advise clients to stay focused on their long-term objectives and not let day-to-day market headlines or events dictate their investment strategy. As legendary investor Howard Marks once said, “In the real world, things generally fluctuate between pretty good and not so hot, whereas in the markets, perception often quickly swings from flawless to hopeless.” We currently view the economy in the “pretty good” camp, and while first half of 2026 brought with it volatility that isn’t uncommon for the markets, well-diversified portfolios have still generated attractive YTD returns of 6-9%.
We believe markets are rarely the reason that investors aren’t able to achieve their goals, but rather decisions made in times of perceived market stress. At Aurdan, we continue to manage portfolios and advise clients through a long-term investor lens. This perspective has been crucial over the past several years in helping clients stay focused on their long-term objectives and avoid making decisions driven by short-term market volatility. We believe maintaining this disciplined approach has been a key contributor to the long-term success of the families and organizations we are privileged to serve. We’re grateful for the trust you’ve placed in us, and we remain committed to guiding you through whatever the markets bring next.
IMPORTANT DISCLOSURES
The views, opinions and content presented are for informational purposes only. The charts and/or graphs contained herein are for educational purposes only and should not be used to predict security prices or market levels. The information presented in this piece is the opinion of Aurdan Capital Management and does not reflect the view of any other person or entity. The information provided is believed to be from reliable sources, but we cannot guarantee the accuracy or completeness of the information, no liability is accepted for any inaccuracies, and no assurances can be made with respect to the results obtained for their use. The information contained herein may be subject to change at any time without notice. Past performance is not indicative of future results.