Introduction

At the end of the first quarter, much of the conversation centered around uncertainty tied to the administration’s rollout of new tariffs and sticky inflation. Markets responded with a sharp bout of volatility and a move lower—something we hadn’t seen in a couple of years. Adding to the pressure were escalating geopolitical tensions, particularly between Israel and Iran, which seemed to signal more turbulence ahead. But that wasn’t the case. May and June saw a strong rebound, with both the S&P 500 and the tech-heavy NASDAQ reaching new all-time highs by the end of the quarter.
This serves as a strong reminder that trying to time the market or making investment decisions based on headlines is incredibly difficult—and often leads to the wrong call.
While the U.S. economy has shown some signs of cooling, it continues to demonstrate resilience. In environments like this, it’s easy to get swept up in headlines and short-term market movements, especially as the narrative can shift so quickly. That’s why we stay focused on long-term themes and the underlying fundamentals when constructing portfolios and making wealth planning recommendations.
Although the recent market rebound has been encouraging, we know that volatility can return just as fast. Our approach remains disciplined: we balance risk, maintain diversification, and always keep your long-term goals at the core of every decision.
The Economy
Economic growth turned negative in the first quarter with real GDP contracting an annualized 0.5%. Under the surface, the numbers were not as bad as the headline print would suggest. Imports, which act as a drag on growth, surged in March as companies raced to ship their goods to the U.S. before tariffs were implemented. Core drivers of growth like consumer spending and investment remained positive in Q1 but slowed from their above-trend pace seen in 2024. This theme of positive but slowing growth is likely to continue for the rest of 2025.
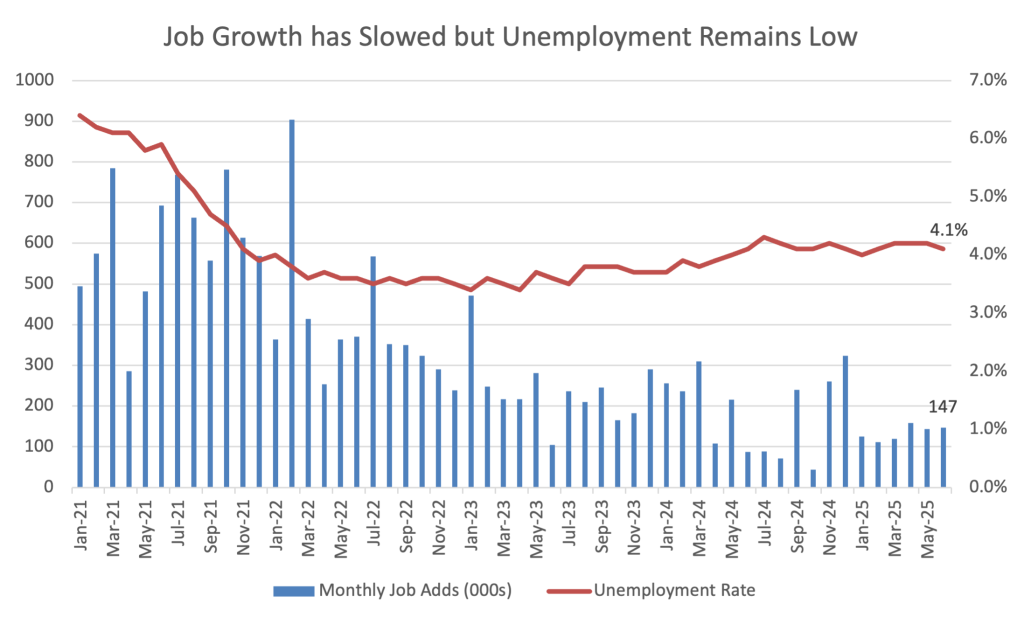
In a similar vein, the labor market remains solid, but cracks are beginning to show. The unemployment rate was little changed over Q2, ending the quarter at a strong 4.1%. Backing this up was annualized wage growth of about 4.0%, which outpaced inflation. While the number of people out of work is low, the pace of hiring has been very slow, meaning it has been hard for those without a job to secure one. Continuing claims, which are those who have filed jobless claims for consecutive weeks, reach the highest level since November 2021 in June. We will continue to watch jobless claims in the coming months as they are typically a leading indicator of economic trouble on the horizon.

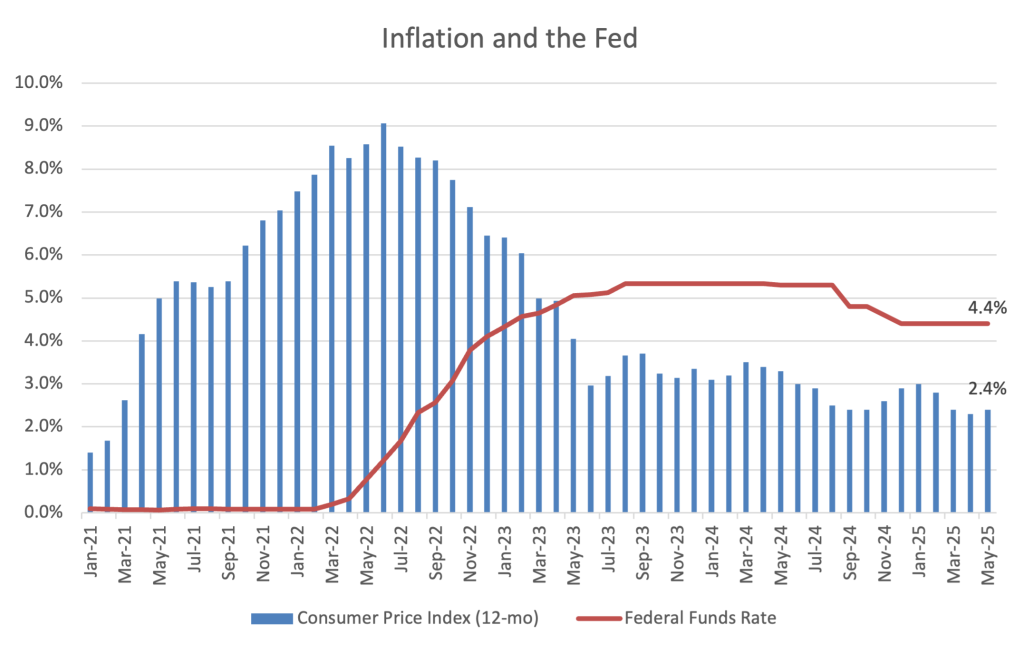
Finally, inflation continued its very slow path to normalization this quarter. The Consumer Price Index (CPI) printed a benign 0.1% increase in May and was up 2.4% over the past year. Tariff-induced price pressures have yet to find their way into the data with goods prices flat over the month of May and rising just 0.3% over the past year. Inflation is likely to remain in the 2.5-3.0% range for the rest of 2025 as the base effect and tariffs push the annual rate upwards.
Overall, the economic backdrop can be described as positive but slowing. Growth is normalizing from the above-trend pace seen in 2023 and 2024. At the same time, the labor market is cooling as the pace of hiring has slowed. Finally, inflation is close to 2.0% but still above the Fed’s desired target. All these factors lead to a complicated picture for the Federal Reserve as they balance their dual mandate of maximum employment and price stability.
The Federal Reserve
Much like last quarter, the Federal Open Market Committee (FOMC) met twice in Q2 and elected not to lower rates at both meetings. The Federal Funds Rate has been in its current range of 4.25-4.50% since December 2024. As mentioned above, the Fed is facing an uncertain and difficult forecasting environment. They could cut rates now to try to head off a slow down in growth and employment but risk a subsequent rise in inflation. Conversely, they could wait to cut until inflation is closer to their 2.0% target but run the risk of slowing growth further and raising unemployment. Assuming there is no recession in 2025, the most likely scenario would be the Fed allows the tariff impacts to flow through the economy over the coming summer months before cutting once or twice in the last four months of the year.
At their June meeting, the FOMC updated their forecasts for the economy and interest rates over the rest of 2025. The Fed lowered their real GDP growth forecast to 1.4% and increased their unemployment rate projection to 4.5%. They also increased their inflation expectations to 3.0% but left their “dot plot” unchanged, calling for two cuts in the back half of 2025. Overall, the revisions were negative as the Fed expects tariffs to slow growth, raise unemployment, and increase inflation.

Tariffs, Geopolitics, and Fiscal Spending
Developments around tariffs, Iran, and the spending bill dominated headlines in the second quarter. On tariffs, the worst of the uncertainty surrounding tariffs appears to be behind us. The cumulative tariff rate is likely to settle in at about 15%. While this is much higher than the 2% at the beginning of the year, it is much more manageable than the nearly 30% rate that was announced on Liberation Day (April 2nd). The increase in tariffs will likely be absorbed with only minor impacts to the wider economy through a combination of supply chain reshuffling, lower corporate profit margins, and higher consumer prices.
Geopolitics were also front and center this quarter as Israel and the U.S. carried out joint airstrikes on Iran’s nuclear capabilities. The main worry for markets was Iran retaliating by closing the Strait of Hormuz, a waterway through which 20% of the world’s oil flows on its path to final destinations in Asia and Europe. However, this extreme scenario now seems unlikely after Israel and Iran agreed to a ceasefire on June 24th. While it is always possible tensions could flare up again, the ceasefire appears to be holding for the moment.
The final theme of Q2 was increased scrutiny of U.S. fiscal spending. Sparking the debate was the One Big Beautiful Bill Act (OBBBA), which passed through Congress in early July. The bill would make the current tax rates set forth in the 2017 Tax Cut and Jobs Act permanent. It would also increase defense spending and raise the state and local tax (SALT) deduction cap while reducing non-military government spending on programs like Medicaid and Supplemental Nutrition Assistance Program (food stamps). The Congressional Budget Office (CBO) estimates the bill will increase the U.S. budget deficit by an additional $2.8 trillion over the next ten years. Current leadership seems content with kicking the fiscal can down the road but eventually the U.S. will have to address this issue through less spending, higher taxes, or, most likely, a combination of the two.

Equities
Stock investors endured a wild ride over the second quarter. The S&P 500 declined 11% the first eight days of Q2 after President Trump announced his sweeping tariff policy on April 2nd. The market then rebounded 9%, one of the largest one-day advances in history, on April 9th when the President announced a 90-day pause on tariffs for all countries except China. The market continued to creep higher over April and early May when on May 12th, the U.S. and China announced a deal to de-escalate their ongoing trade war, sending stock prices up another 3%. The market continued higher in June as optimism around artificial intelligence and increased fiscal spending sent stock prices to all-time highs.
Despite the early-quarter selloff, the S&P ended Q2 up an astonishing 10.9%. Growth and technology stocks were back in the driver’s seat as the Nasdaq 100 surged 17.7%. Value and small cap stocks struggled to keep pace with the Dow Jones Industrial Average and Russell 2000 rising 5.4% and 8.5%, respectively. After outperforming U.S. stocks by nearly 11% in Q1, international stocks kept pace with the S&P 500 in the second quarter, advancing 11.5%. The US dollar weakened by 7.0% against developed market currencies like the Euro and Yen as investors rebalanced portfolios away from U.S. assets post-Liberation Day. The dollar weakness provided a tailwind for U.S.-based investors in international assets.
With this rally, the U.S. stock market is back to richly valued territory, with the S&P 500 trading at 22x forward earnings, above the long-term average of 17x. The S&P 500 remains concentrated as well, with the top ten stocks accounting for 37% of the index. While it is important to have exposure to the technology-focused names that make up a sizeable portion of the index, it is prudent to diversify with allocations to value, small cap, and international stocks. This diversification showed its value in April when most of the global stock market was down much less than the U.S. mega cap technology stocks.

Fixed Income & Alternatives
Fixed income posted modest returns in Q2 but provided solid diversification in early April amid the selloff in stocks. While stock prices were down 11% through the first eight days of the quarter, the Bloomberg US Aggregate Bond Index (AGG) was off just 1%, providing much needed downside protection for balanced portfolios. For the quarter, the AGG finished up 1.3% while the Bloomberg Municipal Index was little changed, down 0.1%. The 10-year Treasury yield ended Q2 at 4.3%, essentially unchanged from the start of the quarter.
Alternatives also showed their value in April, with many alternative asset classes rising throughout the month while public equity prices fell. Infrastructure has been a great diversifier over 2025 as its performance is mostly non-correlated with stock prices and interest rates. The asset class has also been benefiting from three key global themes: digitalization, decarbonization, and deglobalization. Allocations to asset classes like infrastructure, private credit, and private equity can increase income and potential returns while exhibiting lower volatility than public market equivalents. We continue to assess alternative offerings and their role within client portfolios.
Conclusion
Looking back at the first half of the year, markets seemed to move through a full cycle in just six months—from setting new highs in February, to an 18% decline in March and April, and then rebounding to fresh all-time highs in June. This volatility highlights how reactive markets had become—not so much to economic data, but to sudden shifts in tone from policymakers. When attention turned back to the underlying economy and corporate performance, markets generally responded positively as fundamental indicators remained resilient despite the turbulence.
Looking ahead, the interplay between short-term forces like investor sentiment and longer-term drivers such as economic fundamentals and corporate earnings will be key to monitor.
As always, we are available to discuss any of these themes in more detail.
IMPORTANT DISCLOSURES
The views, opinions and content presented are for informational purposes only. The charts and/or graphs contained herein are for educational purposes only and should not be used to predict security prices or market levels. The information presented in this piece is the opinion of Aurdan Capital Management and does not reflect the view of any other person or entity. The information provided is believed to be from reliable sources, but we cannot guarantee the accuracy or completeness of the information, no liability is accepted for any inaccuracies, and no assurances can be made with respect to the results obtained for their use. The information contained herein may be subject to change at any time without notice. Past performance is not indicative of future results.
