Introduction

After two consecutive years of remarkable market returns, it was easy to fall into a sense of complacency, lulled by low volatility and steady gains. However, after a strong start to the year, volatility has returned, exacerbated by the Trump administration’s tariff rollout, jolting investors awake. In last quarter’s commentary, we acknowledged the strength of market returns and resilient economic data but cautioned about potential uncertainties tied to a new administration, policy shifts, and persistent inflation.
Just as 2023 and 2024 were defined by a stark divide between the “haves” — AI and tech — and the “have-nots” — nearly everyone else — the recent market selloff has reversed that trend. The ‘Magnificent 7’ and semiconductor stocks quickly shed 20%, with some of last year’s biggest winners plunging as much as 50%. From there, the selling pressure extended to other momentum trades, particularly consumer discretionary and financials.
Market pullbacks are not uncommon. On average, we see a 5% decline four times a year and at least one 10% correction annually. While multiple factors have contributed to the recent downturn, the primary driver remains policy uncertainty. The administration’s tariff policies, coupled with concerns over stagflation—rising inflation amid slowing or stagnant growth—have heightened investor anxiety. After two strong years, uncertainty affects everyone: investors, business owners, and consumers alike. It forces us to reassess risks, recalibrate expectations, and ultimately, navigate a more challenging landscape. It underscores the importance of maintaining discipline, focusing on long-term fundamentals, and ensuring portfolios are built to withstand periods of volatility.
Tariff Update
After considerable rhetoric around tariff threats, the Trump administration followed through with action—imposing tariffs that were broader than anticipated. This escalation has been a key driver behind the recent market selloff. The administration’s goal is to encourage the return of manufacturing to the U.S. and address longstanding trade imbalances. The greatest concern now is the uncertainty surrounding how other countries might respond. The impact on economic growth and inflation is dependent on how the “who will pay” breakdown plays out. For example, if supply chains absorb more of the costs, it may be more detrimental to growth (i.e., a lower U.S. GDP growth rate). However, if consumers end up paying more for imported items, that may result in a higher inflation rate. While the overall economic impact on the U.S. is uncertain, market volatility is likely to remain elevated as the situation continues to evolve. We are monitoring developments closely and will provide updates as more information becomes available.
The Economy
The economy has shifted down a gear over the past few months, with consumer confidence and consumption pointing towards further slowing ahead. Inflation fatigue and concerns over tariffs are causing consumers to pull back on spending. The impact can be seen in The Conference Board’s Consumer Confidence survey where consumers assess the present and future economic conditions. Consumers haven’t been this negative about their economic prospects since the COVID pandemic. Data from February backed up this negative turn in sentiment with real personal consumption expenditure, which is consumption adjusted for inflation, rising just 0.1%.
The softening in real-time consumption figures prompted economists to cut their growth forecasts for Q1 2025. Goldman Sach’s economic team now projects just 0.3% real GDP growth in the first quarter while the Atlanta Fed’s GDPNow model is even more negative, calling for a 3.7% contraction. The two main culprits of the expected decline in real GDP growth are a slowdown in consumer spending and a surge in imports. A rise in imports acts as a drag on economic growth. This drag increased in the first quarter as multinational corporations swiftly ramped up their imports in the hopes of frontrunning the coming tariffs from the Trump administration. This negative impact on Q1 real GDP is likely to subside in the second quarter.
Luckily, the employment picture remains solid. The unemployment rate is currently 4.2% and has remained in the 4.0-4.2% range for nearly a year. Unemployment claims, which are typically seen as a leading indicator for the broader labor market, have remained low. Job openings continue to outpace available workers, meaning jobs are available for those who are unemployed. Finally, annualized wage growth has been running right around 4.0%, outpacing inflation and providing real wage gains for workers.
Lastly, inflation continues to come in around 3% as February CPI and core CPI rose 2.8% and 3.1% over the past year. This remains above the Fed’s target of 2% and, absent a recession, points to a slower cutting cycle ahead. Costs for services such as shelter and insurance continue to run above their pre-COVID trend, leading to sticky core inflation. Goods prices have also begun to turn higher as businesses adjust prices to account for the incoming tariffs. The Trump administration’s tariff policy recently led Goldman Sach’s economic team to increase their end of 2025 inflation forecast by 0.5%, now calling for 3.5% core inflation by the end of the year.

Overall, the economic picture is murkier than it was just three months ago. Inflation continues to weigh on the lower-and-middle income segments of the country. Uncertainty over tariffs and fiscal policy are also causing consumers and businesses to pull back on spending and investment. The good news is, for now, the labor market remains on firm footing. We will continue to watch leading economic indicators pertaining to consumption and employment, allowing us to swiftly update our economic outlook and portfolio allocations as conditions change.
The Federal Reserve
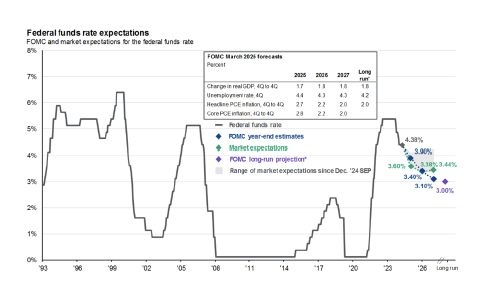
The Federal Open Market Committee met twice in the first quarter and left interest rates unchanged at 4.4% at both meetings. However, the Fed did make one notable change at the March meeting by lowering their monthly Treasury redemption cap from $25 billion to just $5 billion. For the past three years, the Fed has been shrinking its bond portfolio and tightening monetary policy by rolling Treasury bonds off its balance sheet. The recent move to lower the monthly cap to just $5 billion highlights that the Fed is no longer tightening monetary policy and has moved into a more neutral posture.
The Fed also delivered their updated Summary of Economic Projections (SEP) at the recent March meeting. As expected, the Fed lowered their economic growth forecast and raised their inflation expectations in response to incoming tariffs. The Fed now sees 1.7% real GDP growth in 2025, down from their 2.1%projection three months ago. They also see core inflation ending the year at 2.8%, up from their previous forecast of 2.5%. Despite the changes in expectations, the Fed is still penciling in just two rate cuts in 2025, unchanged from their previous SEP. The market is a little more dovish, with futures contracts pricing in three cuts over the next nine months.

The Fed has spent the past three years focused on fighting inflation as the economy and labor markets remained strong. They will now have to balance fighting inflation with supporting a softening economy. The Fed will want to leave rates elevated as long as possible given inflation is above target. However, they may have to pivot and cut quicker than expected should signs of recession begin to appear.
Equities
The first quarter was a rough one for U.S. equity markets as the S&P 500 fell 4.3%. However, the selloff was largely concentrated in technology-focused stocks, which sent the Russell 1000 Growth down 10.0%. Defensive sectors like health care and consumer staples held up much better in the risk-off environment, propelling the Russell 1000 Value to a positive return of 2.1%. Stocks listed overseas performed even better as political developments in Germany and China raised growth expectations in the two large economies. The MSCI ACWI Ex USA, an index of stocks listed outside the U.S., massively outperformed U.S. equities, rising 6.3%.
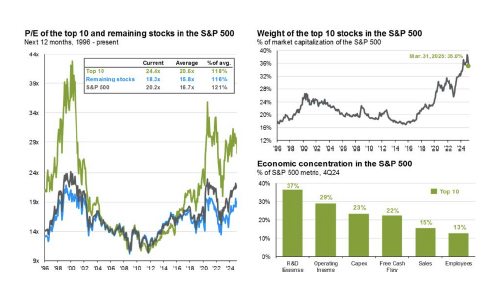
After back-to-back years of 25% returns, a correction in the S&P 500 seemed inevitable at some point in 2025. The index, driven by optimism surrounding artificial intelligence, had become expensive and concentrated. Coming into 2025, the index was trading around 22x forward earnings, well above the historical average of 17x. The index was nearing record levels of concentration, with the top ten stocks accounting for almost 40%of the index. The largest stocks in the index were also becoming increasingly correlated as they all operated in the technology and artificial intelligence sectors. When areas of the market become priced for perfection, even slight bouts of uncertainty can cause elevated volatility and large selloffs.

Fortunately, diversification showed its merits in the first quarter, resulting in portfolios declining much less than the S&P 500. U.S. value indexes and international stocks posted positive returns, highlighting why it’s important to maintain allocations to these asset classes even when they are underperforming their U.S. growth counterparts. While one quarter does not make a trend, the rally in value and international stocks could have more room to run. Earnings growth for stocks in these indexes are projected to catch up to the U.S. growth names over the course of 2025. These indexes also have much more favorable starting valuations, with the Russell 1000 Value and the MSCI ACWI Ex USA trading at 17x and 14x earnings compared to the Russell 1000 Growth at 28x.
Fixed Income & Alternatives
Fixed income returned as a diversifier in the first quarter, providing stable returns while stocks floundered. The 10-year treasury yield declined 35 basis points in Q1, ending the quarter at 4.2%. The decline in yields lifted bond prices, leading to a positive 2.7% return for the Bloomberg U.S. Aggregate Bond Index. Municipal bonds, measured by the Bloomberg Municipal Bond Index, declined 0.5% over the quarter but still provided protection from falling equity prices. With attractive yields and limited correlation to equity prices, fixed income appears positioned to provide its dual objective of stable income and diversification from stocks over the coming quarters.
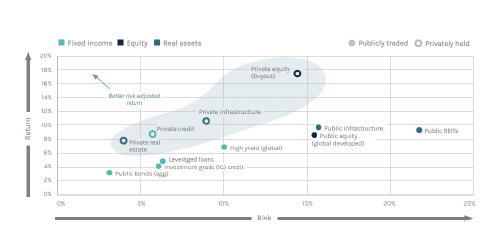
With increasingly volatile equity markets, alternatives in the private markets will play an important role in dampening portfolio volatility while still providing attractive long-term returns. Asset classes like private credit and infrastructure can deliver income above that of equivalent public market assets with lower volatility. Private equity can provide long-term returns above publicly listed stocks but with significantly less volatility. When you combine these asset classes in a portfolio with public market assets, the portfolio displays higher return potential with less volatility. We have been incorporating private assets into portfolios over the past several years and are continuing to explore our options as we move throughout 2025.

Conclusion
After several years of strong market performance, current uncertainty has led to a broad decline across global markets. While market pullbacks and corrections are a natural part of investing, they are understandably uncomfortable. We are closely monitoring both U.S. and global economic indicators for signs of potential headwinds and opportunities.
Within portfolios, diversification—particularly through select fixed income and alternative investments—can serve as an important stabilizer during periods of equity market stress. Thoughtful adjustments, tailored to each investor’s unique goals and circumstances, can help navigate volatility while staying aligned with long-term objectives.
As always, we are available to discuss this in more detail.
IMPORTANT DISCLOSURES
The views, opinions and content presented are for informational purposes only. The charts and/or graphs contained herein are for educational purposes only and should not be used to predict security prices or market levels. The information presented in this piece is the opinion of Aurdan Capital Management and does not reflect the view of any other person or entity. The information provided is believed to be from reliable sources, but we cannot guarantee the accuracy or completeness of the information, no liability is accepted for any inaccuracies, and no assurances can be made with respect to the results obtained for their use. The information contained herein may be subject to change at any time without notice. Past performance is not indicative of future results.
